
Techno-Economic Analysis of Biogas-Fed SOFC System for Wastewater Treatment ⚡🔋
Team
Group members — A.Y. 2025/26
- Sagar Niroula (s353268)
- Sofia Farakhutdinova (s352933)
- Francisco Costa (s350895)
- Afonso Silva (s350896)
- Dang Chuong Ta (s355289)
Course: Polygeneration and Advanced Energy Systems (03QGXND)
Instructor: Prof. [Name]
Institution: Politecnico di Torino — Energy and Nuclear Engineering
Executive Summary
This study evaluates a 120 kW biogas-fed Solid Oxide Fuel Cell (SOFC) system integrated into the Novara wastewater treatment plant serving 102,000 inhabitants. Aspen Plus simulation demonstrated net electrical output of 116.88 kW and thermal recovery of 26.66 kW at 90°C, achieving superior efficiency compared to conventional combustion technologies. The techno-economic analysis over 20 years revealed total CAPEX of €944,155 (€7,868/kW) and annual OPEX of €120,926, with 5-year stack replacement cycles representing a significant recurring cost of €252,000.
The base case yielded NPV of €80,559, IRR of 6.27%, and payback period of 16.33 years, indicating marginal economic viability under current assumptions. Sensitivity analysis identified energy prices as the most critical parameter: a 50% price reduction renders the project unviable (NPV < -1,000 k€), while a 100% increase produces NPV exceeding +2,500 k€ with 3-4 year payback. Stack replacement costs show moderate sensitivity, with the project tolerating up to 30-40% cost increases before becoming uneconomical. Extending stack lifetime from 5 to 10 years provides modest NPV improvements but does not fundamentally alter project economics.
The project demonstrates technical feasibility but operates within narrow economic margins, making long-term power purchase agreements and stack cost optimization essential for commercial viability.
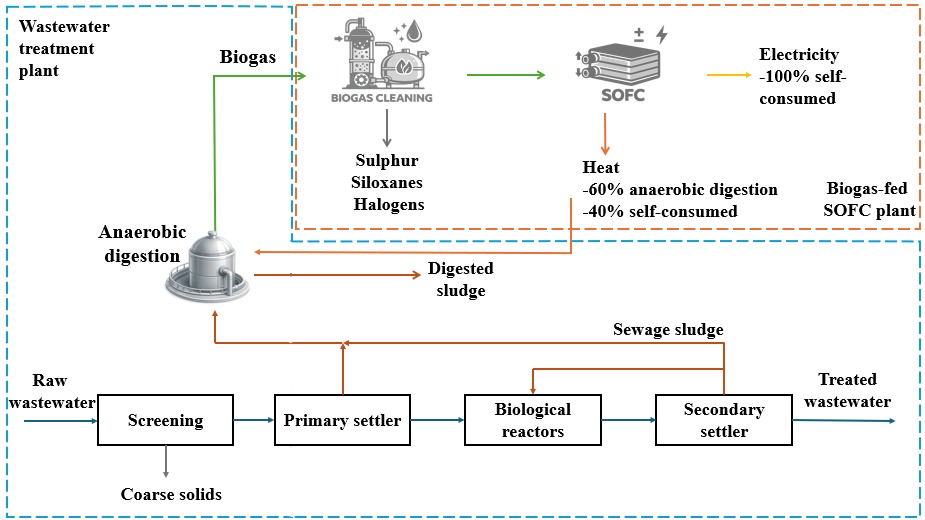
System Overview
The integrated plant converts raw biogas from the Novara WWTP into high-grade energy through three stages [file:59][file:60]:
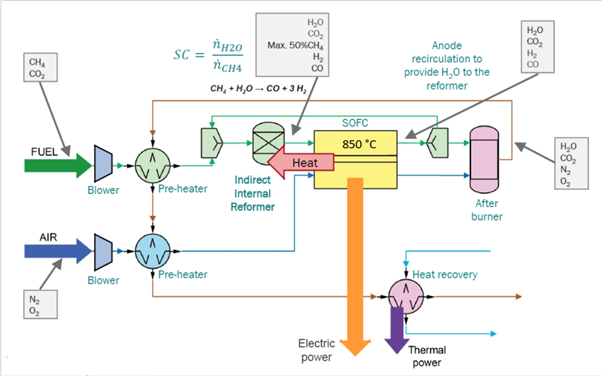
- Biogas Preparation: Compression, pre-heating, and steam reforming with anode recirculation
- Electrochemical Conversion: SOFC stack operating at 850°C generating DC electricity
- Heat Recovery: After-burner and heat exchanger providing thermal output at 90°C
What We Did
- Process Simulation: Modeled complete SOFC system in Aspen Plus including biogas preparation, reforming, electrochemical conversion, and heat recovery.
- Economic Analysis: Evaluated CAPEX/OPEX using discounted cash flow methodology following ISO standards with 20-year lifetime assessment.
- Sensitivity Analysis: Examined energy prices (±100%), stack costs (±100%), and stack lifetime (5-10 years) impacts on NPV, IRR, and payback period.
- Financial Modeling: Calculated NPV, IRR, and PBT using WACC of 5.06% with 70% debt financing and 24% Italian corporate tax rate.
- System Integration: Analyzed thermal integration with anaerobic digester heating and electricity self-consumption scenarios.
Key Findings
Energy prices are critical: 50% price drop → unviable; 100% increase → 3-4 year payback
Stack costs matter: Project tolerates up to 30-40% cost increases before losses
Lifetime extension helps: 5→10 years improves NPV modestly but not decisively
Marginal economics: Base case 16.33-year payback leaves little margin for error
SOFC advantages: 50-60% electrical efficiency vs 28-37% for combustion engines
Results
Base Case Performance
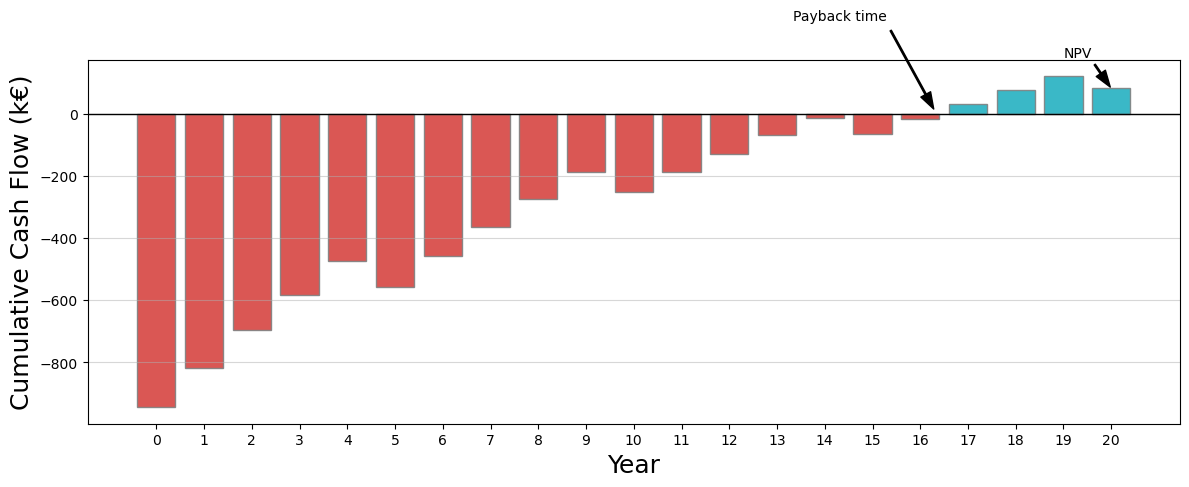
The cumulative cash flow analysis reveals initial investment of €944,155 with negative cash flow for the first 16 years, including periodic €252,000 stack replacements every 5 years.
Sensitivity Analysis
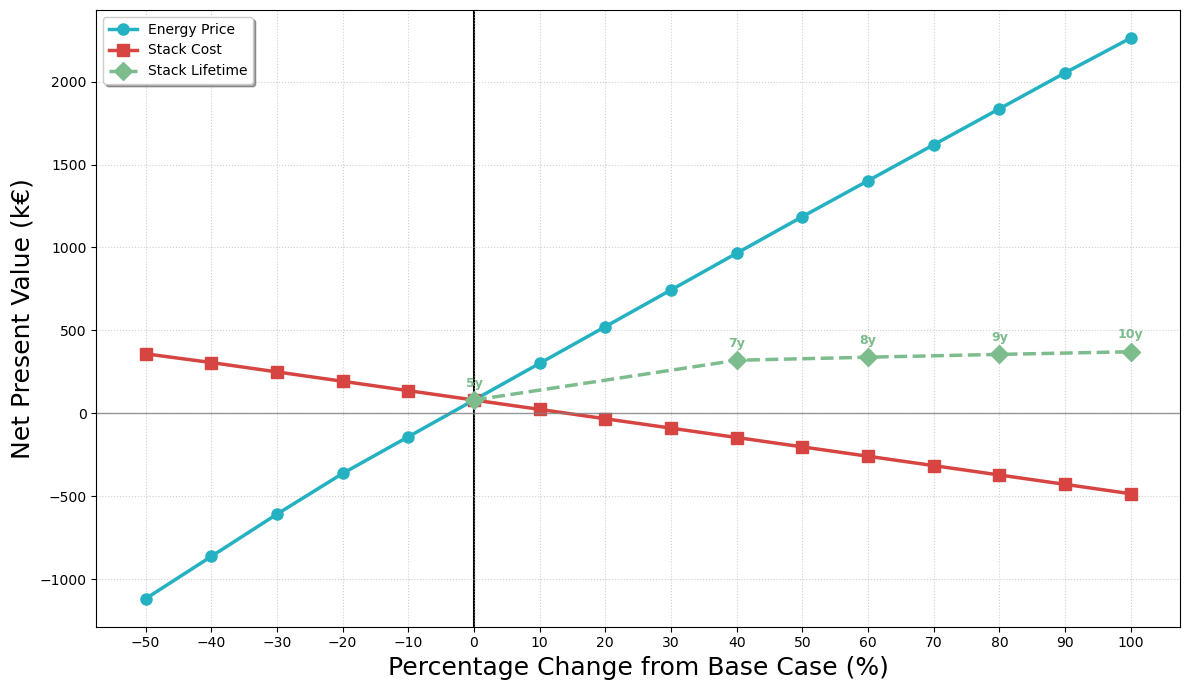
Energy prices demonstrate the strongest influence on project economics, with steep blue line indicating dramatic NPV shifts from -1,000 k€ to +2,500 k€ across tested range.
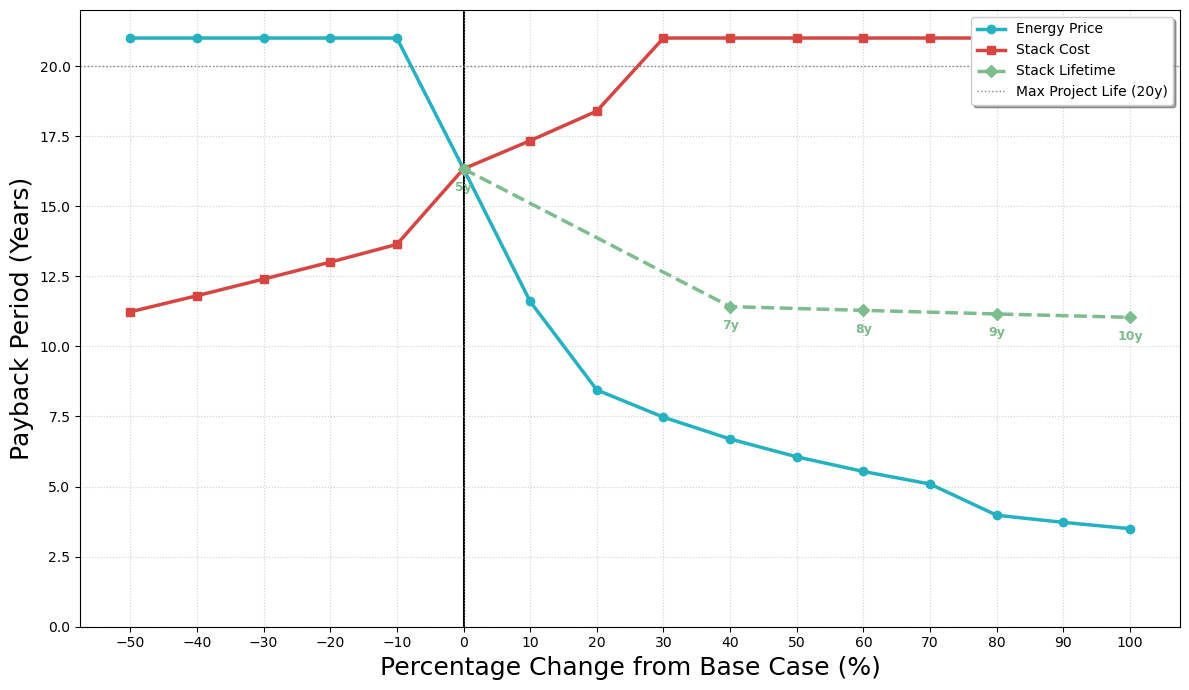
Payback period analysis confirms energy prices as most critical parameter, with base case at 16.33 years extending beyond 20-year lifetime at -50% prices while dropping to 3-4 years at +100% prices.
Documentation
System Performance
| Parameter | Value | Unit |
|---|---|---|
| Electrical Output | ||
| Gross DC Power | 119.87 | kW |
| Inverter Efficiency | 95% | % |
| Biogas Blower Consumption | 0.25 | kW |
| Air Blower Consumption | 2.74 | kW |
| Net AC Power | 116.88 | kW |
| Thermal Output | ||
| Total Heat Recovery | 66.65 | kW |
| Internal Use (60%) | 40.00 | kW |
| Available for Consumption | 26.66 | kW |
| Outlet Temperature | 90 | °C |
| Economic Performance | ||
| NPV (20 years) | €80,559 | - |
| IRR | 6.27 | % |
| Payback Period | 16.33 | years |
| WACC | 5.06 | % |
Cost Breakdown
CAPEX (€944,155 total, ~€7,868/kW):
- SOFC System (2 × 60 kW): €720,000 (76.3%)
- Biogas Cleanup Unit: €60,000 (6.4%)
- Thermal Recovery System: €41,755 (4.4%)
- Plant Preparation & Construction: €122,400 (13.0%)
Annual OPEX (€120,926/year):
- General O&M (5% CAPEX): €47,208 (39.0%)
- Labour (20h/week × €24/h × 52): €23,040 (19.0%)
- Cleanup Unit Maintenance: €4,434 (3.7%)
- Reformer Catalyst: €278 (0.2%)
- Stack Replacement (every 5 years): €252,000
Sensitivity Analysis Results
Energy Price Variations (±100%)
| Variation | NPV (k€) | IRR (%) | PBT (years) | Viability |
|---|---|---|---|---|
| -50% | < -1,000 | < 0% | > 20 | Unviable |
| -20% | -309 | -0.41% | > 20 | Unviable |
| Base (0%) | 81 | 6.27% | 16.33 | Marginal |
| +50% | +1,000 | ~12% | ~7 | Viable |
| +100% | +2,500 | ~18% | 3-4 | Strong |
Stack Cost Variations (±100%)
| Variation | NPV (k€) | Change | Impact |
|---|---|---|---|
| -50% | +432 | +435% | Significant improvement |
| -20% | +281 | +248% | Notable improvement |
| Base (0%) | 81 | - | Reference |
| +30% | ~0 | -100% | Break-even threshold |
| +50% | -130 | -261% | Unviable |
| +100% | -460 | -668% | Highly unviable |
Stack Lifetime Extension
| Lifetime | Replacements | NPV (k€) | Improvement | PBT (years) |
|---|---|---|---|---|
| 5 years (base) | 4× | 81 | - | 16.33 |
| 6 years | 3-4× | 281 | +247% | ~13 |
| 7 years | 3× | 340 | +320% | ~11 |
| 10 years | 2× | 440 | +443% | ~9 |
Technical Specifications
Biogas Input:
- Flow rate: 33.41 Nm³/h
- Composition: 60% CH₄, 40% CO₂
- Capacity factor: 91.3%
- Operating hours: 7,998 h/year
SOFC Stack:
- Configuration: 2 × Convion C60 modules
- Operating temperature: 850°C
- Operating pressure: 1.2 bar
- Fuel utilization: 85%
- Stack voltage: Variable per load
Balance of Plant:
- Steam-to-carbon ratio (SC): 2.5
- Anode recirculation: Yes
- Reformer type: Indirect internal
- Inverter efficiency: 95%
Policy Context
Italian Energy Market (2026):
- Electricity price: €0.2336/kWh
- District heating: €70/MWh
- Corporate tax (IRES): 24%
- Biogas incentives: Waste-derived renewable
Financing Structure:
- Equity: 30% at 8% cost
- Debt: 70% at 5% interest
- WACC: 5.06% (post-tax)
This work was completed as part of advanced energy systems coursework focusing on renewable energy integration and techno-economic feasibility analysis.